Creating a test plan
I recently talked about learning Java Selenium and developing a test automation platform.
In order to prevent mindlessly creating a never-ending set of disconnected test-cases, it was best to develop a test plan. Having a test plan is my best bet at preventing a lot of pains managing automation code and keeping tests running efficiently. You'll see some of the pain I have to live with today below as I explore potential methods to plan out my test code.
I asked myself a list of questions for each method, which would help me determine the feasibility of a given method. I'm going to try to use terms like Poorly Formed / Acceptable / Well Formed to express quality, and terms like Easy / Moderate / Difficult to express, you guessed it, difficulty.
- How is test coverage indicated?
- How is code coverage indicated?
- What's the difficulty to maintain it?
- What's the difficulty to spot duplicate test cases?
- How much work is required to determine the test plan is valid?
- What's the difficulty to visualize test dependencies?
I also had a few tasks I needed to complete before I could start to try out some potential methods.
First, I needed to identify all of the different controls of any page throughout the application (buttons, links etc).
Following that, I wanted to try and collect as much of the application specification documents as possible. These could be in the form of documents saved in a Confluence space, test cases in the existing client Selenium test suite, or talking directly to product stakeholders.
Don't represent your test cases as one large undirected graph
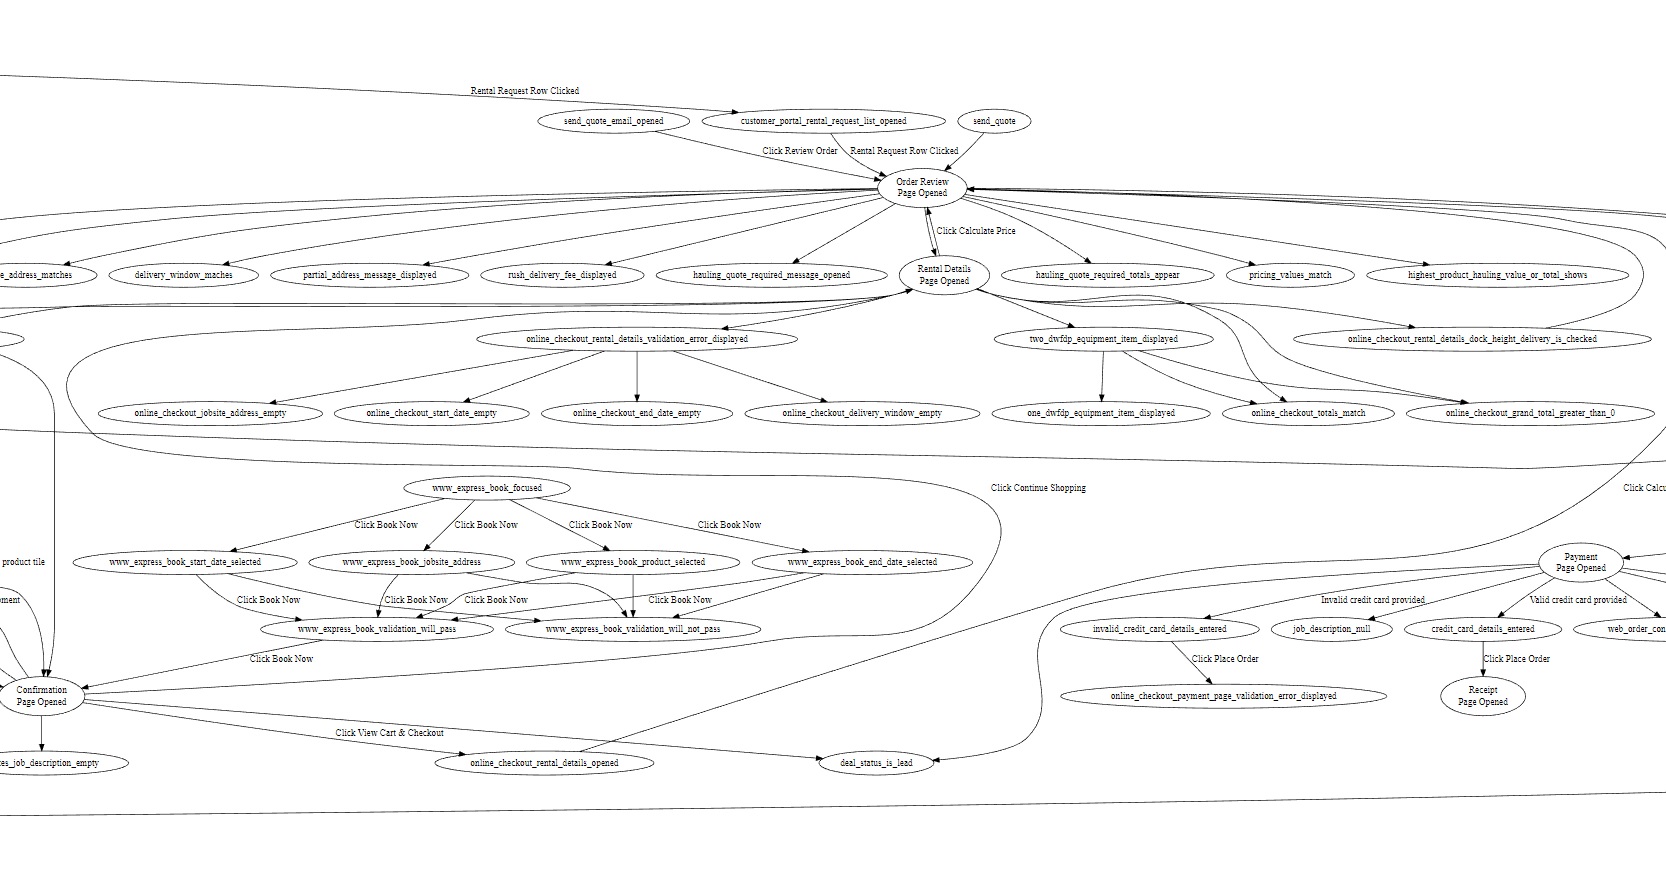
Since I really like using GraphViz, I thought this would be the best way to do it and would make visualization super easy.
I used facts as the nodes and any actions taken as labeled edges. Unlabeled edges were just additional relationships to previous facts.
I had initially started to use the actions as the nodes, but this was confusing since there wasn't a way to highlight what is true at any given point in time without some additional markup.
I think the facts of what describes the current state of the application is a great way to formulate test cases; the "facts" in this are exactly the test cases. This is an almost automatic way to write test cases, leaving only the way to store them the major point in question.
Actions are just the bridge between test cases and help out in a big way construct what each test case, or "fact", is going to say. In a test plan, however I imagine it being, is just the connection between the current facts, the actions that are going to be taken, and new facts of what the state of the application is expected to be in. If it's not, then those "facts" are not true and so the test cases fail.
After a few days, I had an extremely large graph that was tedious to zoom in and out of. I eventually realized this was a bad way to do it. I'll come back to this later on, but for now a large graph is definitely not what I want.
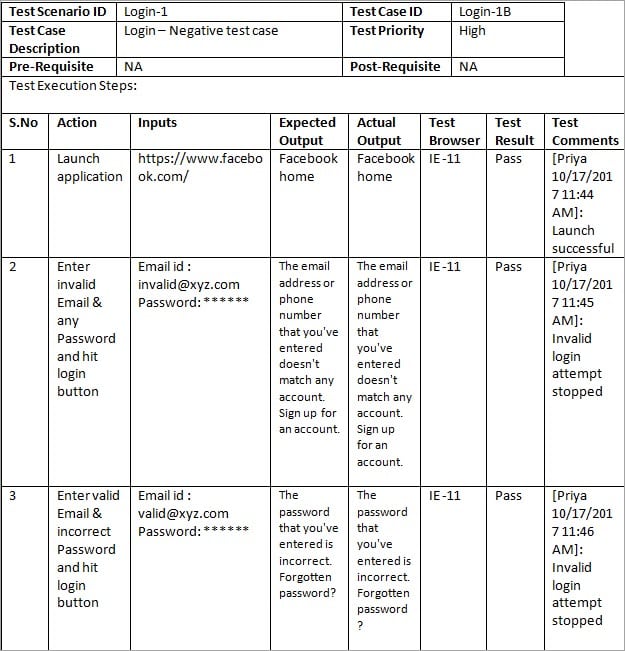
A single large table containing all test cases isn't better
This seems to be a common method to organize test cases in QA land. Every example I could find in testing blogs and Youtube seemed to point to some giant spreadsheet of test cases with columnd dedicated to various metadata like dependencies, test status, reproduction steps etc.

I didn't even try this one out, but after some quick Google searching I ultimately decided the biggest argument against using it was the maintenance burden. Making any change to a test case could ultimately require me to rewrite the entire spreadsheet and it would be almost impossible to verify it was always accurate.
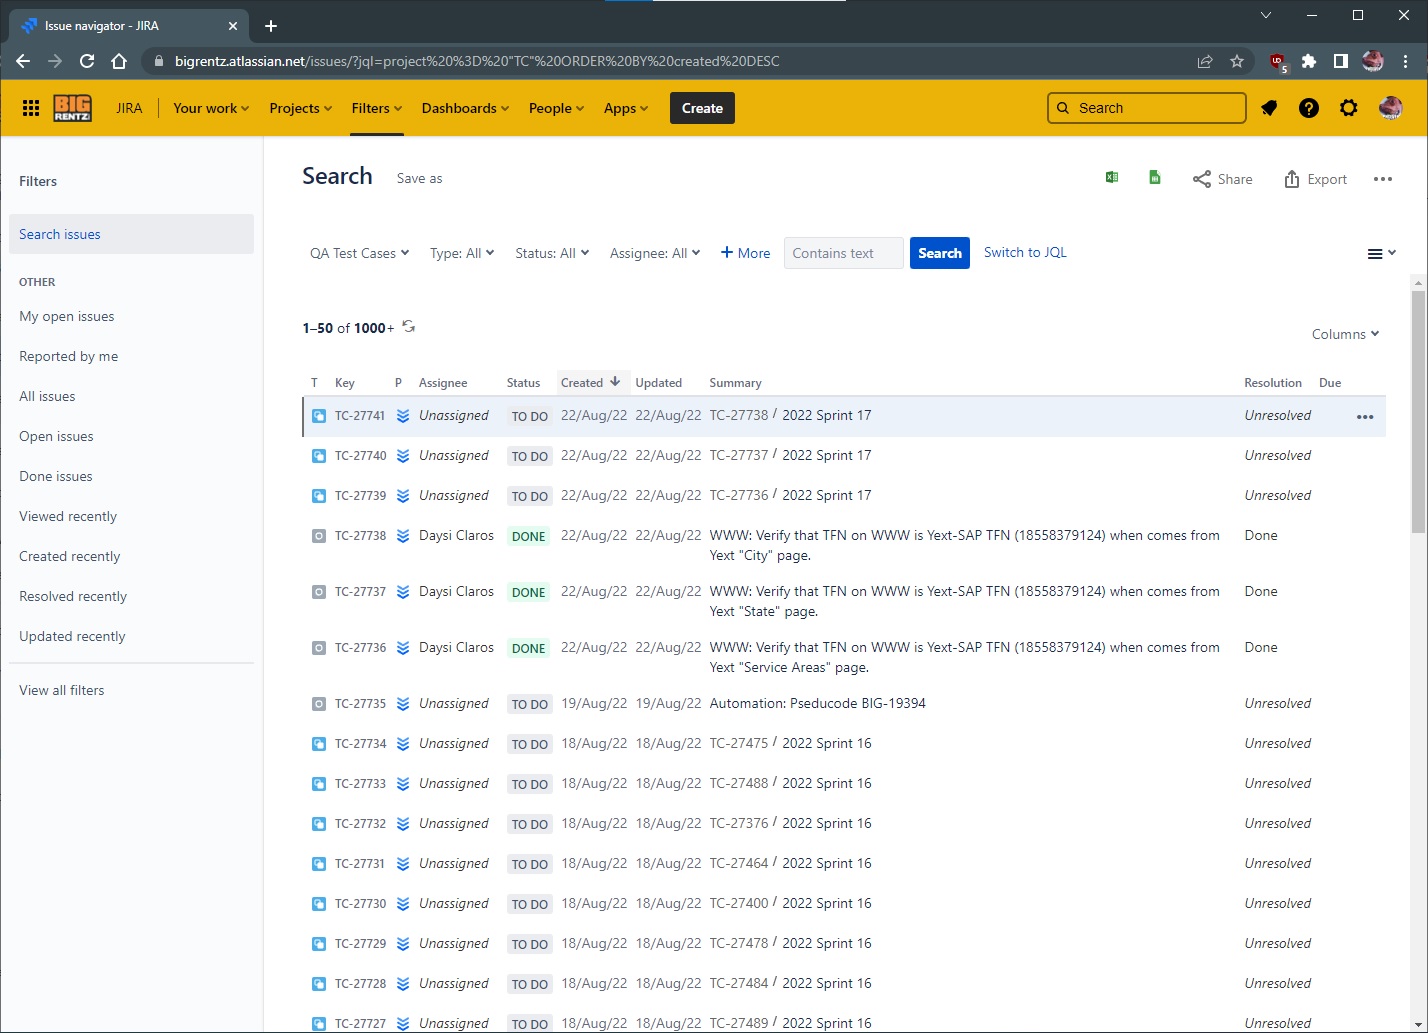
Test cases should not be stored in JIRA
This is a methodology I commonly observe with a lot of QA engineers and it seems painful. Most of the time I discovered the test cases in these tickets were not in the written specification and are a constant source of bug churn for developers.
Obviously, I want a system that's accessible to all parties and one that is simple to view and relate to the system as a whole.
Using multiple small sub-graphs is better than a single large one
This turned out to be easier to manage than one large graph. It helped to zoom into a particular context and think about what is important to a given module or aspect of the system. Keep in mind, this doesn't necessarily mean one component in a UI; it can mean one characteristic that maybe is a theme across the entire system and the graph would indicate everything that could happen to affect the outcome of it.
Multiple small sub-tables don't fare better than a single large table
I thought this might produce better results than the large table method, however I didn't see any benefit to using smaller tables over large tables.
Using tables, graphs, facts and actions together is the best way to formulate a test plan
I know, maybe it's a cop-out answer. But I really think the best outcome of this is a little bit of everything instead of using just methodology.
As I started to think of other options, eventually I started to realize I really liked some of the characteristics of how the graphs were built. The facts (nodes) and actions (edges) provided a super clear visual into what's happening.
I also needed a way to maintain an inventory of existing facts and actions. I can't think of a better way to list these out other than using a table. Now, the table won't have a ton of columns in it - I'm mostly just using one column of a table to literally record the current facts and actions of any given application.
Now that I know how to use Java Selenium, and how the best way is to build a test plan, I can finally start writing some test code. While I'm writing the test code, I'll also be able to make an informed assesment of how well the test and the application are performing and if the application is doing what I expect it to.